The Hidden Cost of Data Reduction

The Business Request
I remember once looking at a suite of thin reports based on one central semantic model. The semantic model was getting ever larger leading to bottlenecks in terms of both workspace storage and performance. The users were noticing refreshes took longer and making changes in the front end led to the report taking a noticeable amount of time to re-calculate and re-render.
So the request came from the Business and it sounded simple:
Can we not just keep the last 3 years' worth of data?
But in semantic models, small changes aren't always small. So I ran a full performance and integrity audit.
The Hypothesis
The assumption was that by reducing the data to just the last 3 years, the speed of the reports would increase and storage size would decrease linearly. Less data means faster refresh leading to faster rendering. Simple, right?
That was the theory but the practice doesn't always bear this out.
Approach
As this was an investigation, the decision was made to focus on 3 of the fact tables in the model, not all of them. These tables were selected as it was felt these had the most historical records so the effect would be largest. An easy win, you might say!
The agreed approach was to limit the relevant entities to 3 years' worth of data and measure the effect of this reduction on three main metrics:
- Model size both in terms of row count and memory resource
- Semantic model refresh times in the Service
- Query times within a selection of the reports
There was also a requirement to check the user interface of the reports to ensure that limiting the data in this fashion would have no adverse effects on the UI and would therefore not be detrimental to the end user.
As this was an investigation, we also chose 5 of the reports to focus on rather than the whole reporting suite. The 5 were chosen as they were the most widely used and most broad in terms of fact table usage.
1. Model Size
The semantic model was downloaded locally from the service. DAX Studio was then connected to this local semantic model and the model size statistics were obtained.
This was repeated a second time with the relevant fact and dimension tables filtered to only include records with a created date within the last 3 years. For the purposes of this investigation this filtering was done in Power Query. But the recommendation is that this is done at the SQL view level in Production.
2. Refresh Times
Both models were then published to a Pro workspace. They were refreshed one at a time and the refresh duration noted. This was then repeated two further times and an average of the three refreshes was recorded.
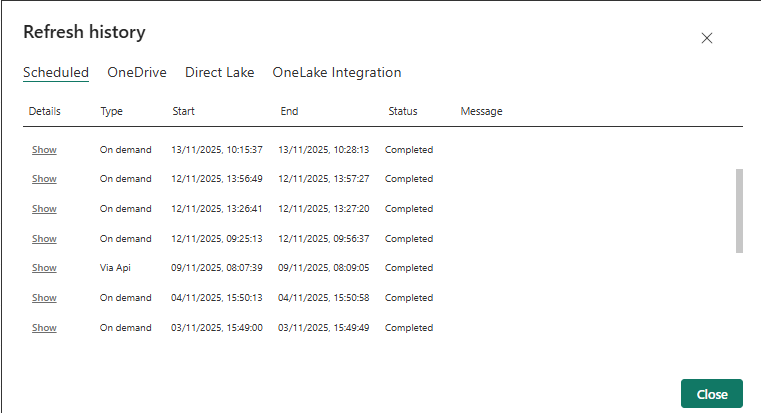
The duration of each run can be found by navigating to the Refresh History option on the semantic model. A pop up box appears detailing the start and end times so that a duration can be manually calculated:
Query Times
Each of the 5 reports were then opened and connected to each semantic model in turn. Performance Analyzer was turned on, a change made in the report and the timings recorded.
To ensure fairness as much as possible, the change made was the same for both semantic models.
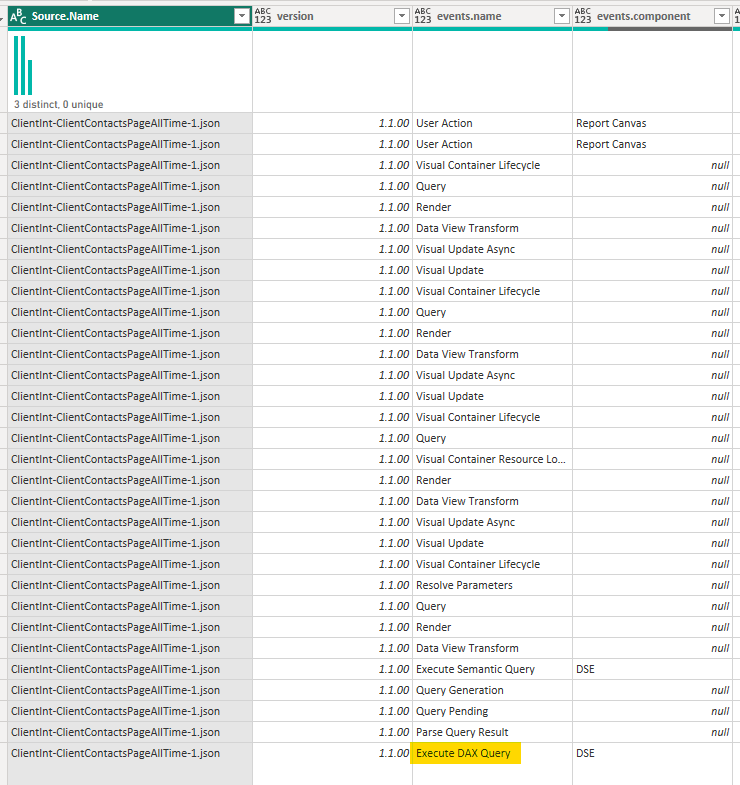
The Performance Analyzer results were then exported as a JSON file. The JSON contains the metrics and duration for a number of background events that occur when a user makes a selection. A number of these events were not relevant here as they would take the same amount of time regardless of the amount of data. Instead the event we were interested in was the "Execute DAX Query" event. This event records the time taken to run the DAX query necessary to re-calculate each metric shown on the page.
So this JSON file was imported into a Power BI report for analysis with the only event we focussed on being the "Execute DAX Query" event.
Findings
Reduction In Model Size
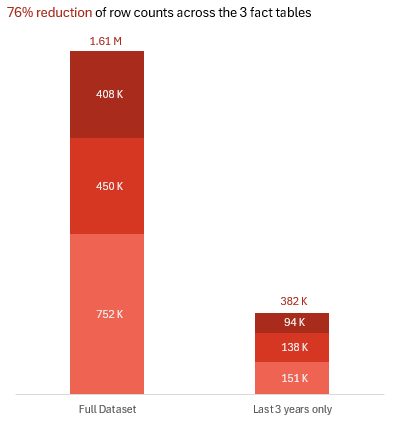
The implementation of the 3 year filter led to a 67% reduction in the size of these three fact tables in the semantic model.
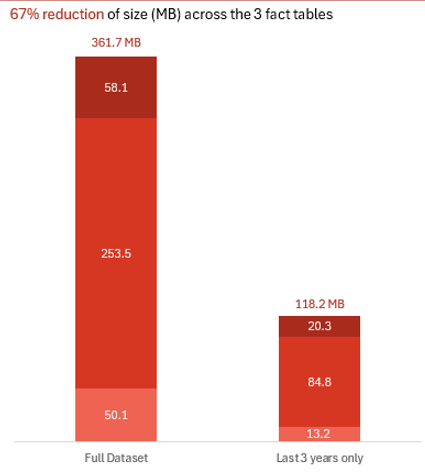
In addition there was also a 76% reduction in the row count for these three fact tables for the semantic model.
Refresh Performance
The refresh was performed three times for each semantic model with the duration in seconds of the refresh being recorded each time. An average of these timings was then calculated. The two averages were then compared to see if there was any reduction in timing.
The refresh was run on both a Premium and a Pro workspace to see if this made any difference.
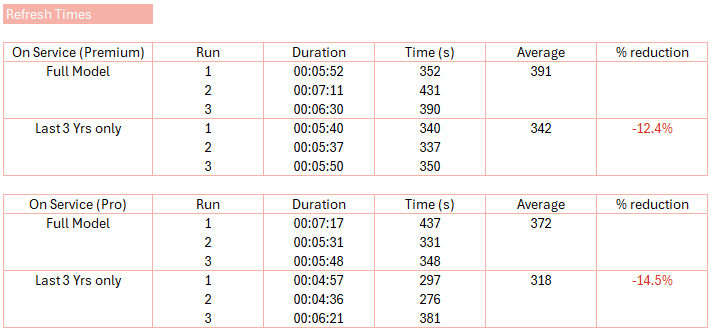
Compared to the other performance metrics, although this is still a 12-14% reduction it is a surprisingly low difference.
This suggests that the bottleneck for model refreshes is not (only) these tables. Instead I suspect it may be due, at least in part, to the complex calculated columns and tables that exist in this model as well as the size of the other fact tables that we haven't reduced.
Query Performance and Integrity
The hypothesis was clean:
- All Time Selection: The reduced model should be significantly faster (scanning 3 years vs. 10+).
- Last 24 Months Selection: Performance should be nearly identical (scanning the same 2 years of data).
The reality was more instructive. While the All Time selection showed the expected dramatic improvement, the surprise was in the Last 24 Months test. Here, the reduced model was still consistently faster. Not by the same margin, but by a measurable, repeatable percentage.
The Lesson: This revealed a hidden cost of scale. A larger model isn't just slower when querying all its data; it carries a performance tax on every interaction, even those touching a recent, common subset. This tax is paid in the formula engine's overhead, relationship traversal, and filter context propagation across a larger structure.
Reducing historical data didn't just speed up queries for old data; it made the entire model more responsive, full stop.
On integrity, a manual review of calculated columns, tables, and measures confirmed no broken dependencies. The reduction was mechanically sound.
All Time No Longer All Time
One big issue to call out was the period slicer and selecting 'All Time'. This was now technically incorrect as for three of the fact tables, the data was reduced to the last 3 years rather than all time.
But because of our definition for the date table (which considered a number of different date fields in the model), it was still possible to view all time data for the other fact tables that we hadn't limited. So the 'All Time' range hadn't changed globally, only in terms of the three fact tables we had reduced.
This would cause confusion for the end user. Both in terms of using and trusting the 'All Time' period selection but also in terms of metrics across the report suite which purport to be 'all time' metrics. This would need consideration before implementing this data reduction.
Calculated Tables
One unexpected result we saw was regarding some DAX tables we have. These calculated tables stored information on subscriptions (one line for every day that a subscription was active) and still produced the same number of rows post the data cull as before. This was because most of the data came from a dimension table which had obviously not been restricted. However because some of the columns for this table were derived from the fact tables that had, they were returning blanks rather than the relevant data (because that data no longer existed).
Conclusion
We achieved significant data size reduction which will lead to improved efficiency and potential cost savings. This also afforded us the headroom in the customer workspaces. The accuracy and performance of the reports did not suffer due to this data purge.
The change made was not technically onerous and therefore was perfectly feasible. As mentioned previously the date filtering should be done in the relevant SQL views in Production. This filter would need to be dynamic so is only ever the last 3 years from the current date.
The data cull did surface two issues though: the 'All Time' slicer that isn't and the calculated tables missing data.
The potential options to resolve these are:
- Remove 'All Time' as an option in the slicer.
- Lock down the derivation of dates for the DimDate table to dates in the last 3 years only.
- Assuming we do this, could also rename the All Time option in the slicer to be "Last 3 years" or similar.
- Educate the user base that we have restricted the data that is imported into Power BI.
- Add a filter into the DAX calculated tables to restrict them to underlying records created within the last 3 years.
What a "Simple" Data Reduction Really Tests
This investigation began with a simple business hypothesis: less data means more speed. It succeeded as a performance fix but it's bigger value was a high-resolution diagnostic of the whole data product.
A "simple" filter change is never just that. It is a stress test for your system's true architecture and the bill for that test, the discovery tax, is where the cost and insight lie.
The Discovery Tax Bill
It exposes hidden bottlenecks
Our 67% data reduction only yielded a 12-14% refresh gain. The bottleneck therefore wasn't only data volume. It was the complex calculated tables and columns in the model. This investigation highlighted the next, more critical issue ripe for optimisation.
It reveals semantic debt
The confusion around the "All Time" slicer and the broken calculated tables weren't bugs. They were symptoms of a missing unified semantic layer and a development process that allowed hidden dependencies.
It demands careful scoping
Our findings were valid for the 5 reports and 3 fact tables we tested. The results however are not linear and so cannot be extrapolated. The discovery tax for a full rollout would include the cost of testing every other report and dependency, This defines the true scope, risk and effort required for this 'simple' change.
The Craftsman's Takeaway
Therefore, treat any "simple" data change as a diagnostic process. Its cost isn't just in the implementation, but in the discovery of everything you didn't know was connected. The wise team uses this discovery not as a setback, but as the most valuable map for what to fix next.
This mindset shifting from task-completion to system-diagnosis is what separates a report builder from an architect.