The Impossible Button

The ask was simple: the user wanted to have a slicer with two options to be able view either "All Sales" or "Customer Sales Only".
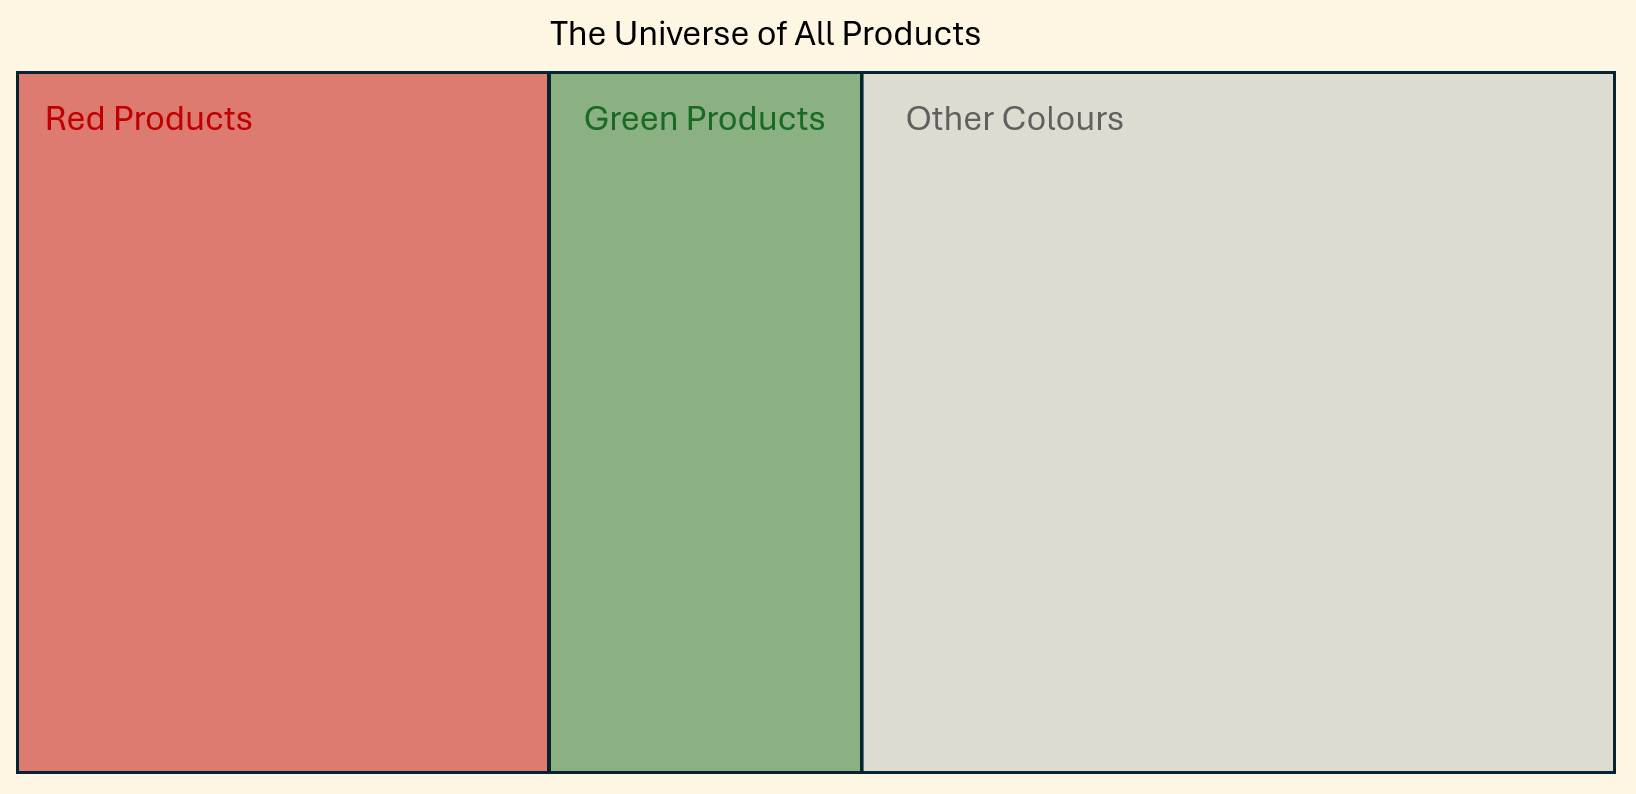
Unfortunately the solution is more complex. The reason is because what the user is asking for is not how a slicer works natively in Power BI. The whole point of a slicer is to "slice" the data into various 'buckets' for more detailed analysis. Discrete categories separate from each other e.g. sales for red products or sales for green products.
This ask however is "show me all sales" vs "show me all sales to external customers only (I don't care about internal / demo customers)". The key thing to note is that there is no analytical value in viewing "sales to internal customers only" so we don't want that appearing in our slicer.
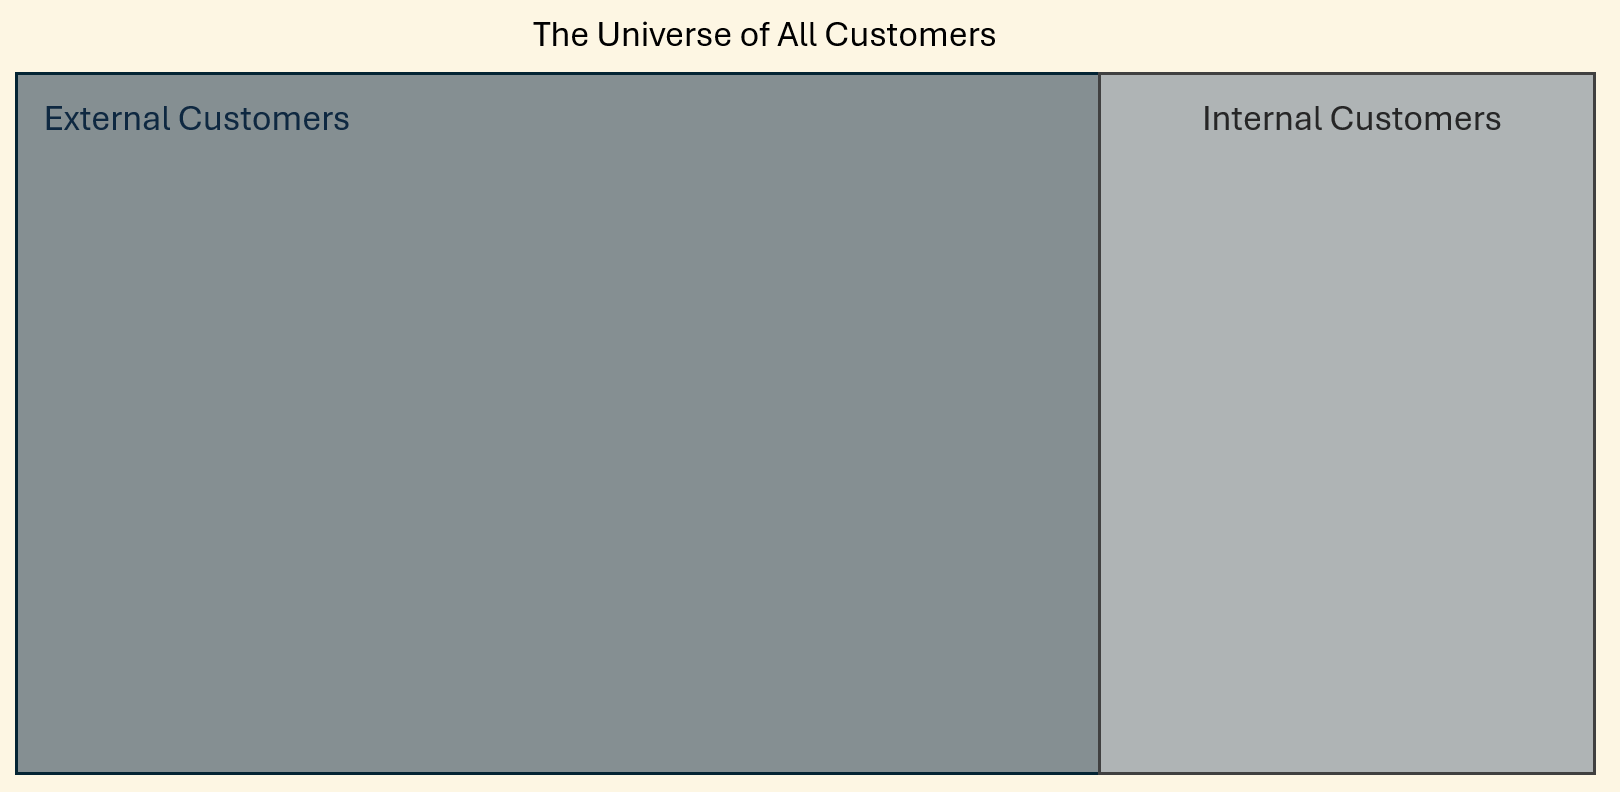
This is not an either / or situation. Instead the two groups overlap. We have "All Customers" which is made up of both "External Customers" and "Internal Customers" and we have "External Customers only" which is a subset of "All Customers".
A simple filter on this column would not work - the slicer would display two options: External or Internal customers. So how do we build an intuitive user interface object based on a non-intuitive data structure?
The solution is not a neat DAX trick. It's a data modelling solution that embodies the ethos of clarity and maintainability.
Why The Obvious Solutions Fail
The Single-Column Trap
The idea here is to add a slicer based on the column as usual. However any solution using just the column involved will give discrete options like the Products slicer. This is not a bug, it is a feature of how Power BI slicers are designed and their usage with discrete categories. So for this slicer, the user would be able to select Internal or External customers. But crucially not All Customers.
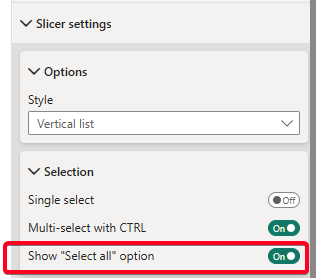
We could convert such a slicer into a multi-select and add a "Select all" however the UI would then have three options: "Internal", "External" or "Select all" and we don't want the user to be able to view internal customers only. So this option clutters up the UI and adds a bit of cognitive load onto the user.
The Outcome: A frustrated user who either has to run two separate reports or mentally add two numbers together.
The Just Use Two Slicers Compromise
Theoretically we could use two separate filters in the user interface. One would allow the users to choose scope (All vs External Only) and one for Account Type (Internal/External). And the user can decide how they wish to use them.
This is sub-optimal for two main reasons. Firstly we are pushing the cognitive load onto the end user by essentially outsourcing the data model logic to the user. Each time they want to choose between All customers or External only, they have to set two different slicers correctly. And if they were to choose contradictory selections across the two slicers e.g. Scope = "External Only" and Account Type = "Internal" then nothing will show. And the user will blame the report and submit a ticket saying the report is broken and shows no data.
The Outcome: A flexible report that is actually unintuitive and error-prone.
The DAX Workaround
While we might be able to conjure up some DAX magic to solve the problem, this is inherently complex, hard to maintain and brittle. Depending on the size of the dataset, it could also introduce performance issues.
We've solved a modelling problem by hiding the complexity in a DAX measure.
The Outcome: A "clever" solution that satisfies the demand but introduces maintenance debt and offers no reusable pattern. It solves the immediate problem but makes the system worse for everyone that comes after.
Building a Bridge With a Dimension Table
The goal is a slicer which gives us two distinct options: one a column-level option "External only" and the other an aggregation of column-level data "All Customers". Once this is realised it becomes obvious that this cannot be solved elegantly at the column level or the original table level.
Instead we need to abstract away such a slicer and allow it to filter the original table. To do this we build a custom dimension table which via filter propagation will filter the original data as we require.
A Step-by-Step Build
Step 1 - Isolate the Core Concept in a Calculated Column
Create a column that flags the specific subset. In my case whether an account is Internal or External.
The source data already had a column called [IsInternalAccount] which returned TRUE or FALSE. So I used this in my calculated column:

Step 2 - Create a Key Column
The next step is to create a key column. This column will be used to create the relationship to the custom dimension table and is generated by concatenating the calculated column created in Step 1 with a string literal saying "All":

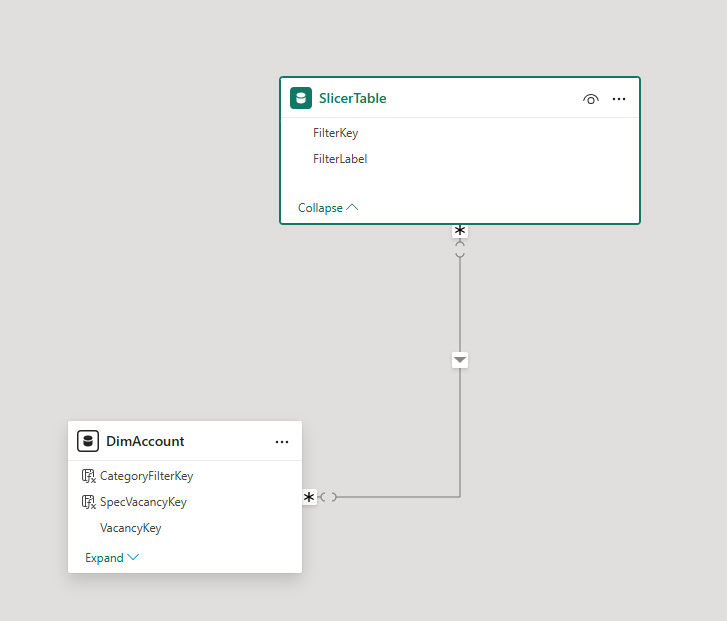
Step 3 - Build the Bridge Table
The bridge table or custom dimension table has to be constructed in a certain way:
- Its data comes directly from the source table (DimAccount in my case)
- It is made up of two columns only:
- The key column (to be able to create the relationship back to the original table)
- And a label column (to be used in the slicer in the user interface)
- We use UNION and DISTINCT to obtain a unique list of all possibilities from the source table
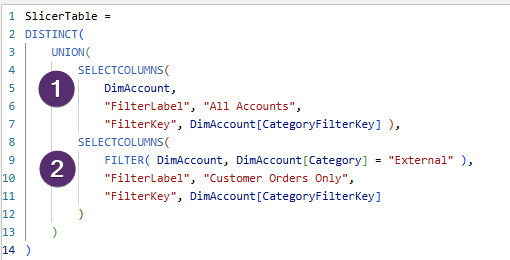
So referring to the screenshot above:
- We see the table is made up of two clauses joined with a UNION
- The first clause is for when the user selects "All Accounts" in the slicer. All options for the original table appear here.
- The second clause is for when the user selects "Customer Orders Only". The FILTER in line 9, means this clause only returns records where the category is "External".
This results in a table looking like this:
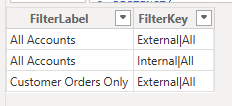
So, in English, if the user selects "All Accounts" from the slicer label, this equates to both FilterKeys "External|All" and "Internal|All". Since there are only two possible keys, this is all of them. And so when we create the relationship to DimAccount, no records are filtered out and all accounts are returned (both external customers and internal customers).
Conversely, if the user selects "Customer Orders Only", this equates to key = "External|All" and this filter will propagate to the original table and only return records which have this key i.e. External customer accounts only.
The rest of the model (which is a star schema) ensures that the correct value of sales is returned in either case.
Step 4 - Create the Relationship
The final step is to create a relationship between this new dimension table and the original table using the key columns. This will be a many-many relationship. The filter direction needs to be from the bridge table to the original table.
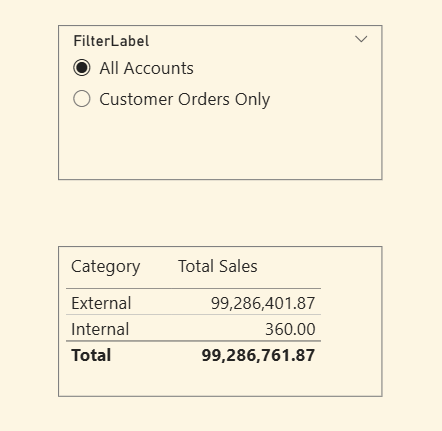
The resultant slicer does what the user needs in displaying overlapping categories. When "All Accounts" selected, we get all sales visible irrespective of whether internal or external customers:
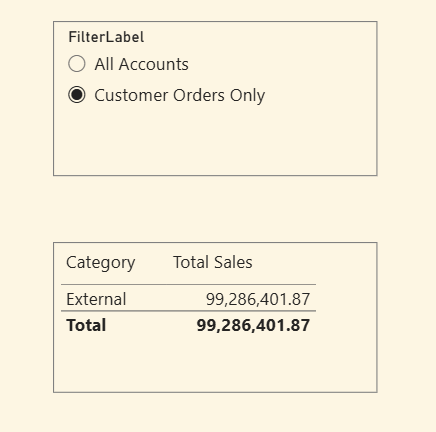
And conversely when we select "Customer Orders Only" we only see the external customer sales:
Why This is a Superior Approach
This is a better approach for 4 main reasons
Clarity
The user gets a simple single slicer with clear options which map exactly to their mental model. The complication is abstracted away from the report layer.
Performance
Filtering via a small, clean dimension table is incredibly efficient.
Maintainability
The logic is embedded in the model rather than in a cryptic measure. The next developer can understand it at a glance. They don't have to go digging through the measures to understand what is happening and how.
Scalability
This pattern is the asset. It can be reused anywhere that an "overlapping category" problem arises.
It's Not A Slicer, It's A Translation Layer.
The solution wasn't in writing DAX but in designing a (small) system that translates a complicated requirement into a simple user experience.
This is the "taps vs pipes" divide in action. The obvious solutions provide the user a stiff tap, a broken tap or water that is scalding. An unpleasant user experience
In contrast this solution delivers a beautiful chrome tap that provides fresh chilled drinking water to the user.
The Takeaway
When faced with complex data challenges, teams often fall into two traps:
A Hasty Conclusion
A quick investigation declares something impossible which shuts down any future exploration.
The Brittle Workaround
Complex solutions (such as DAX 'magic') are used to solve the problem at the report layer leading to maintenance overhead and the introduction of tech debt.
When next faced with an "impossible" UI challenge don't just look at the report canvas. Look deeper, at the data model and build a bridge.