Context
Two months into a new role, I diagnosed that the existing data model had reached its limit. The team was building workarounds instead of foundations. This was my unsolicited proposal to leadership:
Executive Summary
This report is submitted in support of amending the XXX data model to a star schema model.
Power BI is a powerful tool for data visualisation and analysis but to harness its full potential it is crucial to have a well-structured data model.
The Core data model is essential for managing day-to-day transactional operations but is not optimised for analytical tasks. By contrast star schema models are purpose-built for analytics.
Complex models and inefficient queries can consume more storage, lead to slow report generation and negatively impact user experience. Worse, inconsistent models can result in discrepancies leading to inaccurate reporting and decision-making.
Implementing a star schema model can address these challenges. This model will also allow us more easily to cope with more complex analysis needs such as DirectQuery.
Background
Online Transaction Processing (OLTP) vs Online Analytical Processing (OLAP)
Example of an OLTP model:
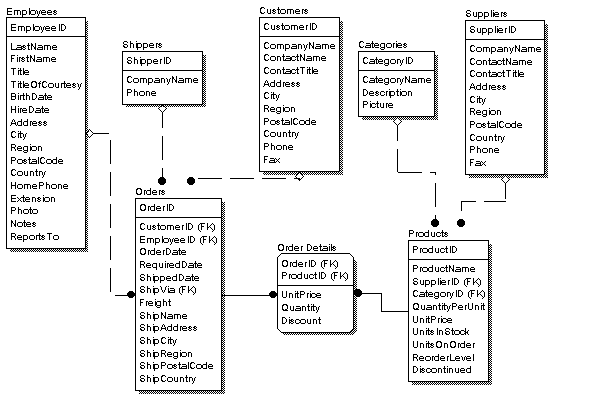
The Core product has an OLTP data model structure. These kinds of models are optimised for transactions as we expect to be writing new transactions on a regular basis (be that every minute, hour, day etc.)
OLTP model structure is therefore compact to attempt to use the least amount of space and will avoid repetitions of the same value in order to speed up inserting new or updating existing data. This model generally increases the number of tables present (because nearly every attribute is in a separate table) and therefore the number of joins between these tables.
On the other hand an OLAP model is structured to be fast for read operations. Insertion of new or updating of existing data never needs to happen when looking at analysis and so OLTP is not a good fit.
OLAP models reduce the number of joins and tables by duplicating data across the whole model. This reduces the number of tables the queries have to traverse to get all the required pieces of data. It also enables fast aggregation and filtering of data which is useful when slicing, dicing, drilling down or rolling up.
Many OLAP systems obtain their data from an OLTP system via an ETL pipeline.
What is a star schema?
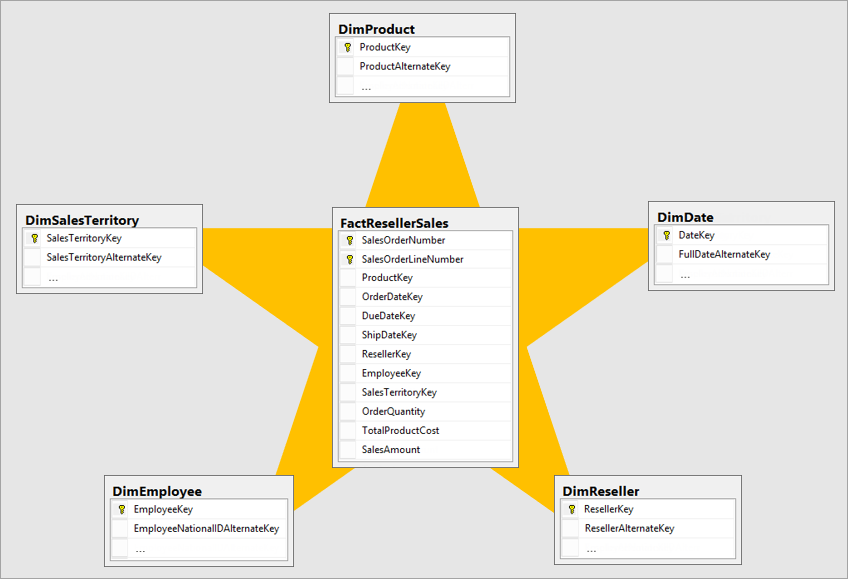
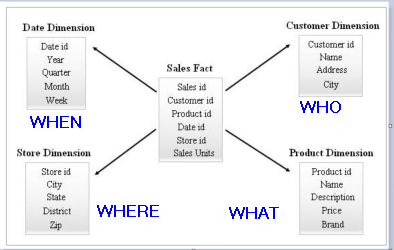
The star schema has become the standard when mapping multi dimensional data structures for analytical purposes. A star schema is an OLAP data structure where the data tables are arranged into two categories:
Dimensions - a dimension table contains descriptive data that will be involved in the event we are seeking to analyse. These are the WHAT, WHERE, WHEN, WHO of the analysis. Examples include Product, Geography, Date/Time, Employee. They provide the viewpoints by which we want to look at the data (for example Sales by Product, by date, by employee). They typically don't have many rows (usually hundreds or thousands) but can have many columns.
Facts - A fact table is a table where each row contains a separate event or transaction which we want to aggregate to obtain insight into the business eg. Sales. These are the HOW MANY or HOW MUCH of the analysis. A fact table typically has fewer columns but many more rows (millions or billions) compared to a dimension table.
It is called a star schema because of the shape of the dimension tables around a central fact table. Usually a star schema would have one fact table but it is possible to have more than one fact table in a model.
Benefits of Star Schema Model
Improved performance
A star schema simplifies the data structure reducing tables and table joins making it easier and faster to query data. They are designed for aggregating and summarizing data.
Enhanced Data Quality
By centralising data using a star schema model, inconsistencies are minimised. They also allow better data governance including data validation and cleansing. Data is usually cleaned, validated and transformed during the ETL process. This ensures the data is accurate and reliable.
Ease of Use
As mentioned, it simplifies the data structure making it easier for developers to create and maintain reports. Developers can learn quickly how to navigate the model to create the requested reports. In contrast, OLTP models often have complex structures that are challenging to navigate for analytical purposes.
Tools like Power BI and Tableau are designed to work effortlessly with star schema models making it easier for non-technical users to create reports.
Scalability
Star schema models can easily accommodate new / different data sources, making it scalable for future business needs. Adding in extra dimension tables is straightforward. Even new fact tables can be added to the model.
As business needs evolve, the model can handle more complex analytical needs for example DirectQuery or analysing historical performance.
Clear data separation
Star schema models separate dimension tables (descriptive data) from fact tables (measurable data) providing a clear structure.
Cost Analysis
A star schema model will require upfront investment in terms of time required to design and implement but the long-term benefits outlined below will outweigh these costs:
- Improved performance
- Easier maintenance of any reports developed using this model
- Better data quality
- Faster development of future reports
- Greater ability to implement more complex analytical requirements
The above points improve the current situation for XXX but crucially also enable easier growth / development of the product in the future.
Risks
Data integration
A star schema model in Power BI requires a robust ETL/ELT process to be built and maintained to transform the OLTP model in the core system into an OLAP model in the datawarehouse which Power BI would then hook up to. This can be done in Azure Data Factory and SQL or we could potentially look at something like Azure Databricks.
Subject Matter Expertise
In order to ensure the ETL or ELT pipeline is set up correctly, we will need subject matter expertise to understand the data in the core product and be able to translate that into an analytic model involving accurate separation of descriptive data and measurable data.
Evolution of business
In order to implement near real-time analysis, the Power BI model will need to be in DirectQuery mode. A star schema is the optimal way to achieve this.
Additionally analysing historical performance and/or trend analysis lends itself to a star schema model.
Reflection
The team did eventually migrate to a star schema. Whether this document influenced that decision, I don't honestly know. What I do know is that this is how I think about architectural layers when no one is asking me.