The Customer Is King

Ignore Feedback at Your Peril
I remember once being involved in the creation of a report. The main visual was a bar chart showing a bar per month over a 12 month period similar to the below:
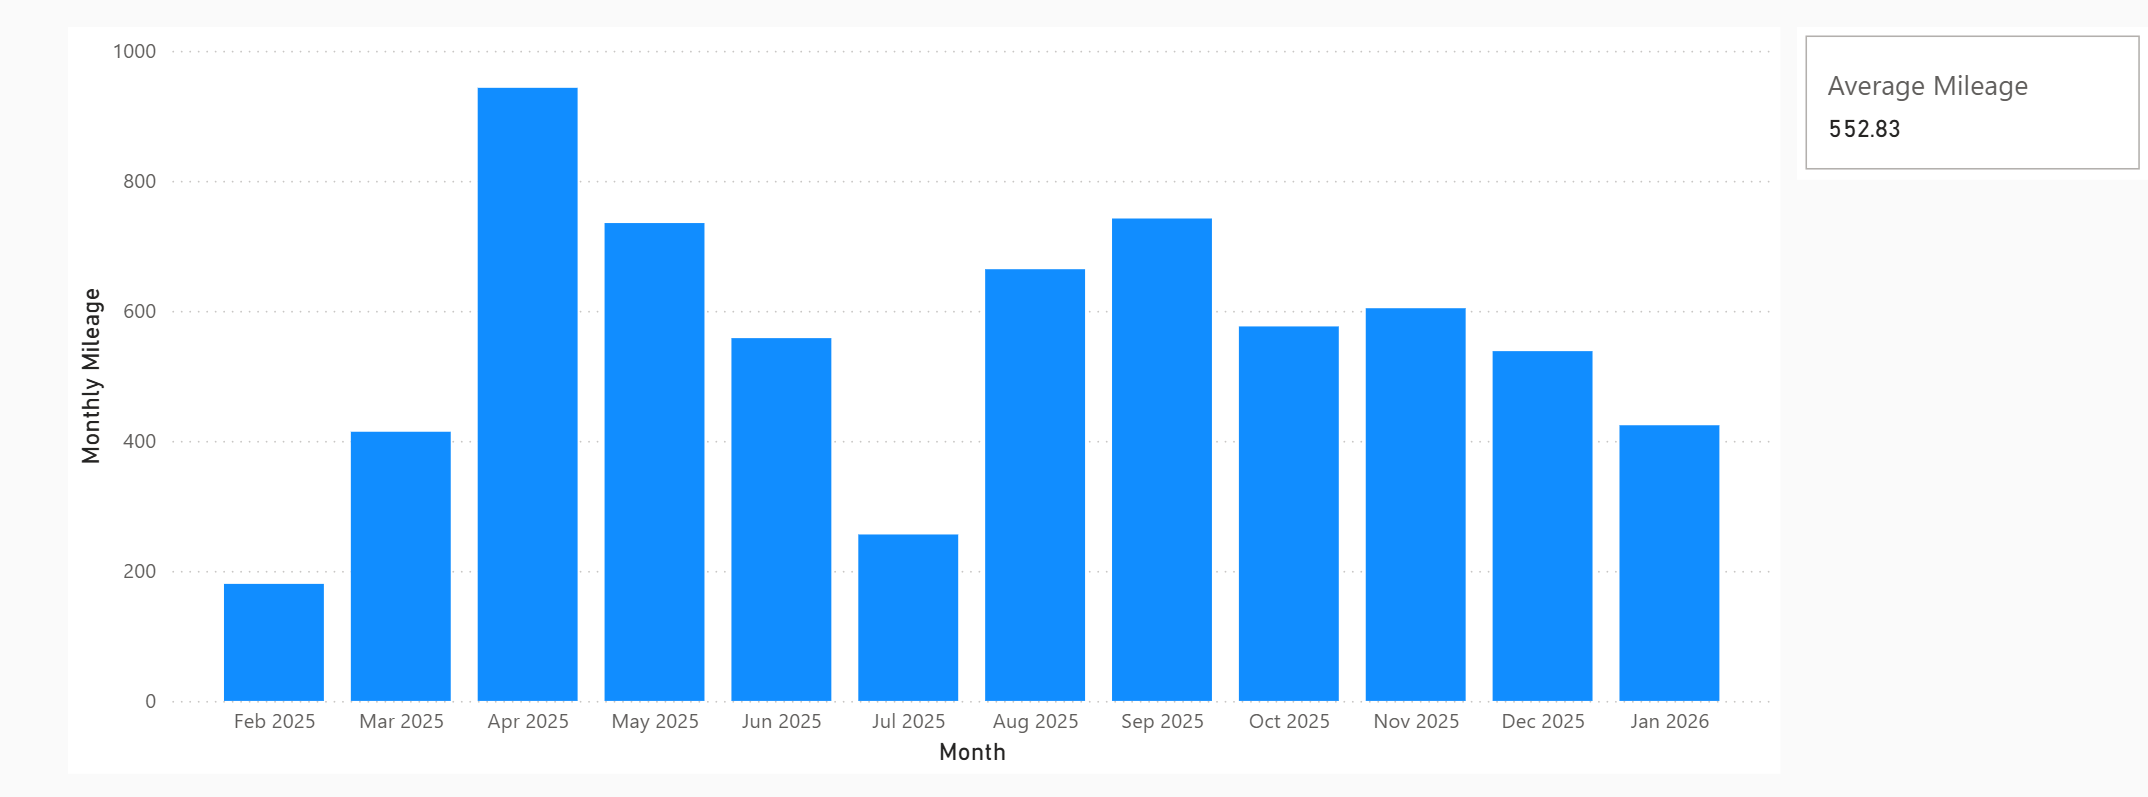
There was a team discussion going on and the product owner was telling us about a call he had been on with the customer. One of the feedback items the customer raised was regarding their wish for an average line to be added to the bar chart visual in Power BI.
This comment got a little bit of push back from the developers. Their reasoning was "there is a card to the right of the chart displaying the average over the period, can't they just use that?"
My thinking was:
(a) Customer Feedback Is Gold
Customer feedback is super valuable and should always be taken seriously to drive the direction of travel. If it's not difficult to implement we should absolutely do what they ask for.
(b) They're Asking For A Visual Enhancement
They're asking for a visual enhancement for a reason: it makes comparison month by month easier and cognitive load lower as they can visibly see how this average compares with each of the month bars.
(c) Customer Is King
They are the subject matter experts and understand the interaction and relationship between the data points. If we're not building to the end users's specifications (who is ultimately paying us) then what are we doing other than massaging our own egos.
The Value of Customer Feedback
True customer feedback is rare and valuable. The end user lives in the report. They use it every day or every week and it helps inform their decision making. A well-crafted report should make it obvious what they need to "do" next.
Because the report becomes a key part of their decision-making process, they will identify and notice the pain points, the friction of the existing report before you, as the developer, will.
Quite simply, they will log more hours using the report than you will. They will identify clunky navigation, illogical processes, slowly-rendering visuals or visuals with high cognitive load.
When they bring an idea it's from a perspective of having struggled and we should never ignore their struggle. Ignoring them risks eroding trust and is likely to damage the relationship with them.
In addition, they tend to surface the most glaring or the highest ROI issues which means that a simple (from the dev's point of view) fix will go a long way in building trust in the relationship, trust in the report and ultimately the rate of adoption of the product.
The Cognition Factor
While it seems like adding such a line is a redundant request, we have to put ourselves in the shoes of the report user. Suppose we want to compare how a particular month has done against the average over the period. This currently involves:
- Looking up the month in question and finding the value by reading the figure off the y axis.
- Then looking up the average as per the card.
- Then mentally comparing the two figures to work out which one is higher.
If the average line was on the chart, this 3 step process would be shrunk to one step: look at month in question and see where the average line crosses the column.
If your user has to think about how to compare two numbers, you've already lost them.
The Developer Trap
The reason we get this behaviour from developers is psychological. When we work on building a report we lose perspective. We can no longer imagine not knowing what we know. This is the curse of knowledge.
On top of this, pride or ego plays a role so we get defensive. We've poured all our efforts into the report, it's become our 'baby' and so any feedback is perceived as criticism. We get defensive and think we know best.
A number of developers are brilliant back end modellers and may have built a technically excellent back end which nevertheless may not be optimal from a UX point of view.
We build from our point of view but the user reads from theirs. And sometimes this means we subconsciously optimise for ourselves rather than our users. This is the Simple For Who? paradigm in action.
Customer-Centric Development
To pivot from this developer trap there are a couple of rules of thumb that I apply:
Is the juice worth the squeeze?
If it is low effort but high clarity for the end user then it should be done to satisfy their requirement. Adding an average line to a chart in Power BI being an example of this.
Remember who you're building for
Our domain of expertise is the technology. Being able to build something that gives value to the end user. They are paying for a service and we need to be mindful of this.
Where possible, we should prioritise end-user experience over back-end neatness.
Put yourself in the end user's shoes
Pause and imagine the situation where you had to use the report daily. A small issue, a small manual or mental calculation compounds and grows in irritation when you face it every day. You are the expert at building the report but the customer is the expert at using the report.
A Broader Lesson
A customer-first mindset doesn't mean saying yes to every request. It means weighing up the request in terms of development effort, usability and impact.
Often, small changes in UX deliver disproportionate value.
Teams that embrace this and work with the end users win trust and adoption. And when your end users are happy, word spreads and they become your first marketers.
Conclusion
When faced with a customer request, do not get defensive. Do not dismiss out of hand. Instead really try and understand why. Why do they need that? What insight or value does our report miss currently?
These sort of reflections and changes in perspective are great lessons and will improve your ability to deliver reports which are adopted as decision-making artefacts rather than vanity art installations that gather dust.
At the end of the day, the customer isn't just the user, they decide whether the product succeeds or not.